Gemloom
Research Log No. 9Topic: Sizing and diversification
Position Diversification: Small Positions in Many Coins, Using a Few Successes to Cover the Cost of Failures
Today's topic is position sizing and diversification. In the latest full-market scan snapshot, only 8 of 519 Binance USDT spot trading pairs passed all hard filters. In the past 24 hours, the review council sent 19 to review, passed 13, and the Risk officer had the most buy votes. Live trading has only 1 closed signal, with a 100% win rate and 9.89% average return, but the sample is too small to draw conclusions. We insist on small positions in each coin, diversified across multiple coins, using a few successes to cover the majority of failures.
Key points- The full-market scan snapshot shows that only 8 of 519 trading pairs passed the hard filters; the screening funnel is very strict.
- In the past 24 hours, the review council passed 13 signals, and the Risk officer had the most buy votes, but the overall sample size is still relatively small.
- Live trading has only 1 closed signal, with 100% win rate and 9.89% average return; the sample is too small, so we need to persist with small positions and diversification.
Coin Selection Funnel: From 519 Trading Pairs to 8 Candidates
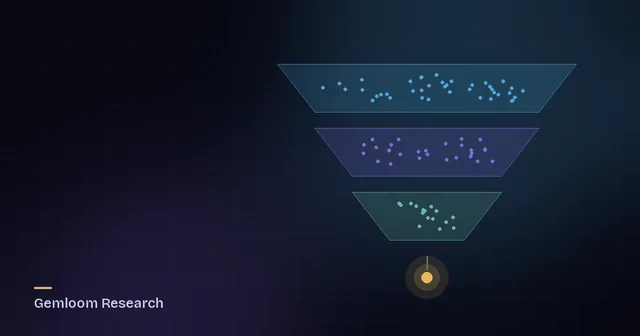
The latest full-market scan (snapshot) shows that there are 519 Binance USDT spot trading pairs in total, 275 have market caps within the research scope, and only 8 passed all hard filters. Figure 1 illustrates this funnel: from 519 trading pairs, to 275 meeting the market-cap criteria, to 8 passing the hard filters. Reasons for not passing hard filters include: 206 with market caps outside the research scope, 168 with risk tags, 87 with insufficient or unstable liquidity, 30 not yet in a bottom area, and 4 with too short a listing time. These numbers come from the rule engine's hard filtering, not AI judgment.
In the past 24 hours, the review council sent 19 to review, passed 13, red-flag vetoed 2, had 3 with insufficient affirmative votes, and 1 under review. Red-flag categories include 1 announced delisting or placed under monitoring, and 1 project suspension. Figure 1 also shows the review council stage. Note: the scan numbers are a single snapshot, while the review council numbers are the statistics for the past 24 hours.
Cross-validation of the Potential Board and AI Reviewers
Figure 2 shows the potential scores and drawdowns from peak for the top coins on the potential board. For example, GALA has a potential score of 63 and is 90% below its peak, ZEN has a potential score of 57 and is 79% below its peak, SSV has a potential score of 57 and is 74% below its peak, CELO has a potential score of 51 and is 86% below its peak, and KAVA has a potential score of 51 and is 80% below its peak. These scores are generated by the rule engine and do not represent AI conclusions. The potential board is not selected by AI.
Figure 3 shows the stance distribution of the four reviewers over the past 24 hours. The Risk officer cast 12 buy votes, 5 wait-and-see votes, and 2 avoid votes; the Fundamentals analyst cast 2 buy votes, 2 wait-and-see votes, and 1 avoid vote; the Skeptic cast 3 buy votes, 1 wait-and-see vote, and 1 avoid vote; and Technicals cast 2 buy votes, 2 wait-and-see votes, and 1 avoid vote. The review council's conclusions come from AI. From Figure 3, the Risk officer had the most buy votes, but the total number sent to review is only 19, so the sample size is not large and needs cautious interpretation.
Position Sizing and Diversification: Why Only Small Positions in Each Coin
A significant portion of small-cap coins will fail, which is the premise of this strategy. Therefore, we do not concentrate heavily in a single coin; instead, we put only a small amount in each coin and diversify across multiple coins, using a few successes to cover the cost of many failures. The live trading public track record shows only 1 closed signal, with a 100% win rate, average per trade of 9.89%, median 9.89%, max drawdown 0%, and average holding period of 4.4 days. But it must be emphasized: this sample is extremely small, with only 1 closed signal, and cannot represent the strategy's long-term performance. There are 13 signals in holding, and 0 closed in the last 7 days, indicating that live trading is in an early stage and needs more data for validation.
The benefit of diversification is that even if some coins fail, it will not deal a fatal blow to the overall portfolio. We do not provide any specific position sizing ratios or buy recommendations in this article; we only emphasize that small positions and diversification are the core of risk control. When the sample size is insufficient, any win rate and return figures can only serve as reference and cannot be used to draw conclusions.
Limitations and What It Means for Users
The biggest limitation of this research is the very small sample size. There is only 1 closed signal, and although the review council passed 13, most are still in holding, so there is insufficient closed-trade data to evaluate the strategy's win rate and return distribution. The full-market scan is a single snapshot and does not represent the market's ongoing state. Therefore, the distributions shown in Figures 2 and 3 are for reference only and cannot be extrapolated.
What it means for users: this is a vertical AI quantitative system that focuses only on small-cap coins in Binance USDT spot that are at price bottoms. We do not promise returns, provide buy or sell advice, or imply that any coin will rise. If users refer to our research, they need to understand the high-risk nature of small-cap coins, control position sizing and diversification on their own, and be mentally prepared for the majority of failures.